Sightline Lite setup guide: your numbers, your chart and your colours
NS. Studio · 2026-11-03
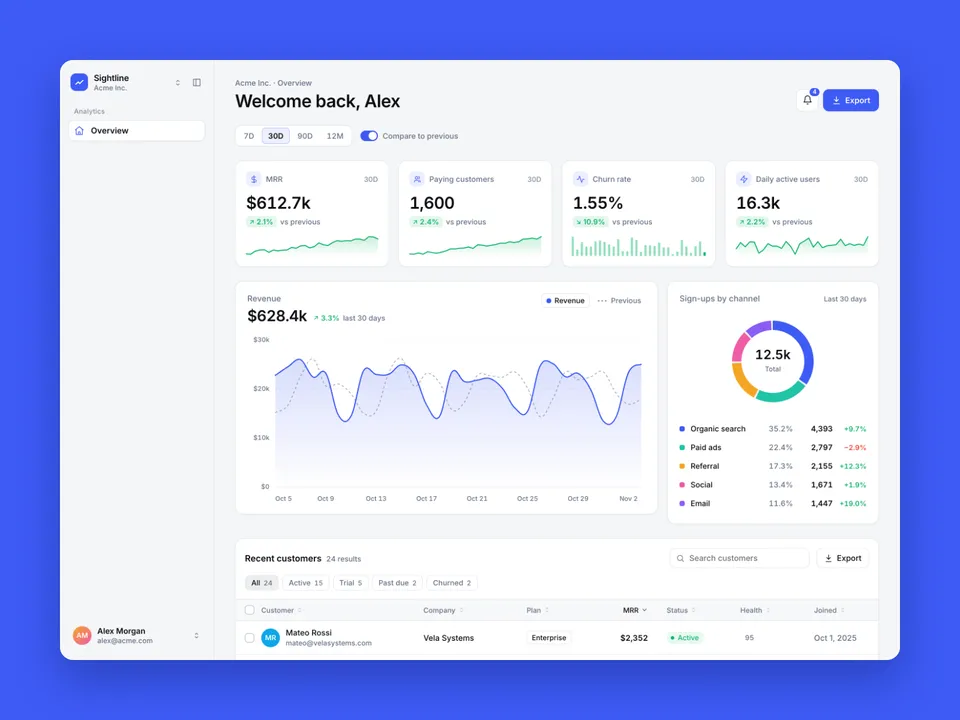
Sightline Lite is a free, one-screen SaaS analytics dashboard for Framer. This guide covers what to change after you remix it: your name and text, your numbers, the colours, the sidebar, and publishing. Keep the live demo open in another tab to compare.
What it is and isn't: one page with demo data, no CMS. It is not connected to Stripe, a database or any analytics service. The numbers come from the data you paste into the components, so it suits a product demo, a mockup or a starting point, not a live reporting tool. The funnel, cohort reports, command palette and extra pages are in the paid Sightline.
1. Remix and rename
- Open the remix link from the Sightline Lite page (or the Framer Marketplace listing) and click Remix. The project is copied into your Framer account.
- Open Site Settings, General and replace the site title, description and social image with your own.
- Replace the product name and logo in the sidebar and the top bar, and the demo people and companies that appear in the table (they are made up).
- The footer has a small "Want the full dashboard? Sightline" note. Delete it whenever you like.
2. Fonts and colours
All text is Inter, which is in Framer's font picker, so there is nothing to install. The colours come from 9 colour styles: open the Styles panel and change the Accent once to restyle the whole page. The code components (KPI, Chart, Breakdown, Table, Range) also have their own colour and font properties in the right panel; the defaults follow the same palette, so only change them if you want one card to look different.
3. The range switch
Select the range switch at the top of the page. Default sets the opening range (7D, 30D, 90D or 12M), Options lists which ranges appear, and Compare shows the "Compare to previous" toggle with its own label. Every KPI card, the chart and the breakdown listen to it, so they always show the same period.
4. Your KPI cards
Select a KPI card (MRR, paying customers, churn rate, daily active users). In the right panel:
- Label: the name shown on the card. Icon, Sparkline and the line or bar style are optional.
- Your Data: paste your own numbers, one
label, valuepair per line, for exampleJan, 1200thenFeb, 1380. The card and its change badge are calculated from what you paste. - Scale multiplies the numbers, and Currency sets the symbol (leave it empty for counts and percentages).
- Seed: with no data pasted, any text here changes the demo numbers, which helps if you use several dashboards in one mockup.
5. The revenue chart and the sign-ups breakdown
- Chart: choose Area, Line or Bar, which metric to plot, whether the previous period is drawn as a dashed line, and the grid and legend. Paste your own series in Your Data the same way as for a KPI card.
- Breakdown: the sign-ups by channel. It has a list of rows, each with a Label and a Value, under Your Data. Rename the channels, change the values, and choose a donut, bars or a meter as the display.
Pasted data is yours to keep in sync: nothing updates by itself. If you want live numbers, you would need to connect your own data source with code, which Lite doesn't do.
6. The recent customers table
The table has search, status filters, sorting, paging, row selection and a CSV export of what is on screen. Its rows are the built-in demo customers, and they can't be edited from the property panel. In the panel you can set the title, the number of rows per page, which tools show (search, filters, export, selection) and the colours. If you don't need it, delete the table or use it as it is for the mockup.
7. Sidebar, notifications and the 404 page
The sidebar has one item (Overview) and collapses to icons. In the Sidebar component you can change the Brand name and mark colour, the workspace names, the Items (label, icon, link, badge and section) and the plan usage block at the bottom. Extra pages are not included, so a new item has nothing to open until you add a page and link it. The notifications menu belongs to the Toolbar component: edit each notification's title, text, time and icon in its Notifications list. The 404 page is a normal Framer page you can edit.
On tablet and phone the sidebar turns into a top bar with a slide-in menu. Check both widths after you change any text, as longer labels wrap.
8. Publish and connect your domain
Click Publish to go live on a free framer.website address (the free plan shows the Framer badge). To use your own domain, upgrade the project to a Framer site plan, open Site Settings, Domains, add the domain and copy the DNS records Framer shows into your domain registrar. Framer's help article How to connect a custom domain covers each registrar. Sightline Lite has no CMS, so it fits the Basic plan.
9. Optional tools
The dashboard works as it is. If you put it inside a product site or demo, these two tools fit around it:
- Chatbase for an AI support chat trained on your docs, to sit beside a product demo.
- Fillout for a feedback or early-access form with logic, linked from the dashboard page.
Some links on this page are affiliate links. If you sign up, NS. Studio may earn a commission at no extra cost to you.
Want more?
The paid Sightline ($59) is the full dashboard: 8 pages, the funnel and cohort reports, a command palette, a CMS of customer profiles and sign-in and settings pages. If you'd rather not set Lite up yourself, template setup starts at $79: your numbers and colours filled in, and your domain connected.